Daily POC Lines - Clustered
Overview
This indicator automatically plots horizontal lines at the Point of Control (POC) for each daily candle, intelligently clustering nearby levels to reduce visual noise and highlight the most significant price zones where volume concentration occurred.
What Makes This Original
Unlike standard volume profile indicators that show static profiles for the entire chart, this script:
Calculates individual POC levels for each daily candle within a user-defined lookback period
Implements an intelligent clustering algorithm that merges POC levels within a customizable percentage threshold, preventing chart clutter from redundant lines
Dynamically highlights high-significance clusters (multiple days sharing the same POC level) with customizable visual styling
Provides granular control over line extension, label positioning, and visual appearance
How It Works
The script divides each daily candle's price range into configurable bins (default 20) and distributes the day's volume across these levels to approximate the POC. When multiple days produce POC levels within the specified clustering threshold (default 2%), they merge into a single line with a counter showing how many days share that level.
Key Features
Adjustable lookback period (1-500 candles)
Intelligent clustering with customizable threshold percentage
Separate styling controls for regular POCs vs. high-count clusters
Toggle visibility for lines and labels independently
Configurable line colors, widths, styles (solid/dashed/dotted), and extension
Date labels with cluster count indicators
Adjustable label positioning and offset
Use Cases
Traders can use clustered POC levels to:
Identify key support and resistance zones based on historical volume concentration
Recognize high-significance price levels where multiple days' POCs converge
Reduce chart clutter while maintaining visibility of important volume-based levels
Combine with other technical analysis methods for confluence
Settings
The indicator organizes inputs into four logical groups:
General Settings - Lookback period, cluster threshold, volume bins
Line Settings - Visibility, color, width, style, and extension options
Label Settings - Visibility, position, offset, and color
Cluster Highlights - Threshold and custom styling for high-count clusters
Important Notes
This script uses an approximation method for POC calculation by dividing each candle's range into bins. For maximum accuracy, use on daily timeframe charts. The clustering feature is particularly useful when analyzing longer lookback periods where many POC levels may naturally converge around similar price zones.
Technical Details
Written in Pine Script v5
Maximum 500 lines on chart
Requests daily timeframe data using security function
Uses arrays to store and manage POC data efficiently
Redraws all lines on the last bar for optimal performance
In den Scripts nach "point of control" suchen

SCTI - D14SCTI - D14 Comprehensive Technical Analysis Suite
English Description
SCTI D14 is an advanced multi-component technical analysis indicator designed for professional traders and analysts. This comprehensive suite combines multiple analytical tools into a single, powerful indicator that provides deep market insights across various timeframes and methodologies.
Core Components:
1. EMA System (Exponential Moving Averages)
13 customizable EMA lines with periods ranging from 8 to 2584
Fibonacci-based periods (8, 13, 21, 34, 55, 89, 144, 233, 377, 610, 987, 1597, 2584)
Color-coded visualization for easy trend identification
Individual toggle controls for each EMA line
2. TFMA (Multi-Timeframe Moving Averages)
Cross-timeframe analysis with 3 independent EMA calculations
Real-time labels showing trend direction and price relationships
Customizable timeframes for each moving average
Percentage deviation display from current price
3. PMA (Precision Moving Average Cloud)
7-layer moving average system with customizable periods
Fill areas between moving averages for trend visualization
Support and resistance zone identification
Dynamic color-coded trend clouds
4. VWAP (Volume Weighted Average Price)
Multiple anchor points (Session, Week, Month, Quarter, Year, Earnings, Dividends, Splits)
Standard deviation bands for volatility analysis
Automatic session detection and anchoring
Statistical price level identification
5. Advanced Divergence Detector
12 technical indicators for divergence analysis (MACD, RSI, Stochastic, CCI, Williams %R, Bias, Momentum, OBV, VW-MACD, CMF, MFI, External)
Regular and hidden divergences detection
Bullish and bearish signals with visual confirmation
Customizable sensitivity and filtering options
Real-time alerts for divergence formations
6. Volume Profile & Node Analysis
Comprehensive volume distribution analysis
Point of Control (POC) identification
Value Area High/Low (VAH/VAL) calculations
Volume peaks and troughs detection
Support and resistance levels based on volume
7. Smart Money Concepts
Market structure analysis with Break of Structure (BOS) and Change of Character (CHoCH)
Internal and swing structure detection
Equal highs and lows identification
Fair Value Gaps (FVG) detection and visualization
Liquidity zones and institutional flow analysis
8. Trading Sessions
9 major trading sessions (Asia, Sydney, Tokyo, Shanghai, Hong Kong, Europe, London, New York, NYSE)
Real-time session status and countdown timers
Session volume and performance tracking
Customizable session boxes and labels
Statistical session analysis table
Key Features:
Modular Design: Enable/disable any component independently
Real-time Analysis: Live updates with market data
Multi-timeframe Support: Works across all chart timeframes
Customizable Alerts: Set alerts for any detected pattern or signal
Professional Visualization: Clean, organized display with customizable colors
Performance Optimized: Efficient code for smooth chart performance
Use Cases:
Trend Analysis: Identify market direction using multiple EMA systems
Entry/Exit Points: Use divergences and structure breaks for timing
Risk Management: Utilize volume profiles and session analysis for better positioning
Multi-timeframe Analysis: Confirm signals across different timeframes
Institutional Analysis: Track smart money flows and market structure
Perfect For:
Day traders seeking comprehensive market analysis
Swing traders needing multi-timeframe confirmation
Professional analysts requiring detailed market structure insights
Algorithmic traders looking for systematic signal generation
---
中文描述
SCTI - D14是一个先进的多组件技术分析指标,专为专业交易者和分析师设计。这个综合套件将多种分析工具整合到一个强大的指标中,在各种时间框架和方法论中提供深度市场洞察。
核心组件:
1. EMA系统(指数移动平均线)
13条可定制EMA线,周期从8到2584
基于斐波那契的周期(8, 13, 21, 34, 55, 89, 144, 233, 377, 610, 987, 1597, 2584)
颜色编码可视化,便于趋势识别
每条EMA线的独立切换控制
2. TFMA(多时间框架移动平均线)
跨时间框架分析,包含3个独立的EMA计算
实时标签显示趋势方向和价格关系
每个移动平均线的可定制时间框架
显示与当前价格的百分比偏差
3. PMA(精密移动平均云)
7层移动平均系统,周期可定制
移动平均线间填充区域用于趋势可视化
支撑阻力区域识别
动态颜色编码趋势云
4. VWAP(成交量加权平均价格)
多个锚点(交易时段、周、月、季、年、财报、分红、拆股)
标准差带用于波动性分析
自动时段检测和锚定
统计价格水平识别
5. 高级背离检测器
12个技术指标用于背离分析(MACD、RSI、随机指标、CCI、威廉姆斯%R、Bias、动量、OBV、VW-MACD、CMF、MFI、外部指标)
常规和隐藏背离检测
看涨看跌信号配视觉确认
可定制敏感度和过滤选项
背离形成的实时警报
6. 成交量分布与节点分析
全面的成交量分布分析
控制点(POC)识别
价值区域高/低点(VAH/VAL)计算
成交量峰值和低谷检测
基于成交量的支撑阻力水平
7. 聪明钱概念
市场结构分析,包括结构突破(BOS)和结构转变(CHoCH)
内部和摆动结构检测
等高等低识别
公允价值缺口(FVG)检测和可视化
流动性区域和机构资金流分析
8. 交易时区
9个主要交易时段(亚洲、悉尼、东京、上海、香港、欧洲、伦敦、纽约、纽交所)
实时时段状态和倒计时器
时段成交量和表现跟踪
可定制时段框和标签
统计时段分析表格
主要特性:
模块化设计:可独立启用/禁用任何组件
实时分析:随市场数据实时更新
多时间框架支持:适用于所有图表时间框架
可定制警报:为任何检测到的模式或信号设置警报
专业可视化:清洁、有序的显示界面,颜色可定制
性能优化:高效代码确保图表流畅运行
使用场景:
趋势分析:使用多重EMA系统识别市场方向
入场/出场点:利用背离和结构突破进行时机选择
风险管理:利用成交量分布和时段分析进行更好定位
多时间框架分析:在不同时间框架间确认信号
机构分析:跟踪聪明钱流向和市场结构
适用于:
寻求全面市场分析的日内交易者
需要多时间框架确认的摆动交易者
需要详细市场结构洞察的专业分析师
寻求系统化信号生成的算法交易者

Open Interest Footprint IQ [TradingIQ]Hello Traders!
Th e Open Interest Footprint IQ indicator is an advanced visualization tool designed for cryptocurrency markets. It provides a granular, real-time breakdown of open interest changes across different price levels, allowing traders to see how aggressive market participation is distributed within each bar.
Unlike standard footprint charts that rely solely on volume, this indicator offers unique insights by focusing on the interaction between price action and changes in open interest (OI) — a leading metric often used to infer trader intent and positioning.
How it works
The Open Interest Footprint IQ processes lower timeframe price and open interest data to build a footprint-style chart that shows how traders are positioning themselves within each candle.
Here’s a breakdown of the process:
1. Granular OI & Price Sampling
The script retrieves lower-timeframe data (1-minute, 1-second, or 1-tick, based on your setting).
For each candle, it captures:
High and low prices
Price change direction
Change in open interest (OI)
2. Classifying Trader Behavior
For each lower-timeframe segment, the indicator determines the type of positioning occurring based on price movement and OI change:
If price is moving up and open interest is increasing, it suggests that long positions are being opened. This is considered a "Longs Opening" event, labeled as UU (Up/Up).
If price is moving up but open interest is decreasing, it indicates that short positions are being closed. This is referred to as UD (Up/Down), or "Shorts Closing."
If price is moving down and open interest is increasing, it signals that short positions are being opened. This is known as DU (Down/Up), or "Shorts Opening."
If price is moving down while open interest is also decreasing, it means that long positions are being closed. This is labeled as DD (Down/Down), or "Longs Closing."
These are stored in separate arrays and displayed at specific price levels.
It is particularly useful for identifying:
Where longs or shorts are opening/closing positions
Stacked imbalances (indicative of potential absorption or exhaustion)
Value area zones and POC (Point of Control) based on OI, not volume
This footprint runs on your choice of sub-bar granularity and is ideal for high-frequency trading, scalping, and entries based on order flow dynamics.
Key Features
Footprint Visualization
At each price level within a candle:
Long/short opening and closing behavior is broken down.
Delta (net open interest change) is displayed both numerically and color-coded.
Optional gradient coloring shows intensity and type of flow (longs/shorts opened/closed).
Cumulative or per-bar reset modes allow you to track OI evolution over time.
The image above explains the information that each Footprint box shows across a candlestick!
Each footprint box shows:
OI Delta
OI Delta %
Longs Opened (LO)
Longs Closed (LC)
Shorts Opened (SO)
Shorts Closed (SC)
The image above explains the color-coding feature of the indicator.
Boxes are color coded to show which position action
dominated at the price area.
For this example:
Green boxes = Long positions being opened dominated
Purple boxes = Long positions being closed dominated
Red boxes = Short positions being opened dominated
Yellow boxes = Short positions being closed dominated
All colors are customizable.
Additionally, for traders who are only interested in whether OI increased/decreased, a "two-color" option is available in the settings.
For the two-color option, footprint boxes can be one of two colors. Showing whether OI increased or decreased at the level.
Cumulative Levels
Open Interest Footprint IQ contains a "Cumulative Levels" feature that tracks/stores open interest change at tick levels over time, rather than resetting per bar.
With the "Cumulative Levels" feature enabled, traders can see open interest changes persist across all candlesticks. This feature is useful for determining whether longs opening, longs closing, shorts opening, or shorts closing are dominating at particular price areas over time rather than on a single bar.
A useful feature to see if shorts/longs are favoring certain price throughout the day, week, month, etc.
Input Settings Explained
Granularity (Dropdown: Granularity)
Options: 1-Minute, 1-Second, 1-Tick
Determines how finely the script samples the lower timeframe data to construct the footprint.
For precision:
1-Tick = Highest accuracy, but more resource-intensive.
1-Second/1-Minute = Suitable for broader or more zoomed-out analysis.
Tick Level Distance (Tick Level Distance (0 = Auto))
Defines the vertical spacing between levels in the footprint chart.
If 0, the script uses an automatic calculation based on ATR to adapt to volatility.
Set a manual value (e.g., 5) to control the height granularity of each level in ticks.
Cumulative Levels (Toggle)
If enabled, the footprint builds cumulatively over time, rather than resetting per candle.
Use case: Visualize ongoing buildup of OI activity across a session or day.
Cumulative Levels Reset TF (Timeframe)
Sets the reset interval for the cumulative view (e.g., reset daily, hourly, etc.)
Works only when Cumulative Levels is enabled.
Delta Box Display Settings
Show Delta Percentage
Toggles the display of the percentage change in OI across the footprint level.
Helpful to gauge how aggressive positioning is relative to total OI at that level.
Show Longs/Shorts (Opened/Closed)
Show Longs Opened: Displays OI increase in up candles (price ↑, OI ↑).
Show Longs Closed: Displays OI decrease in down candles (price ↓, OI ↓).
Show Shorts Opened: OI increase in down candles (price ↓, OI ↑).
Show Shorts Closed: OI decrease in up candles (price ↑, OI ↓).
These behaviors are color-coded to give traders instant context:
Blue-green for longs opening.
Purple for longs closing.
Red for shorts opening.
Yellow for shorts closing.
Value Area & POC
Value Area % (Value Area %)
Controls how much cumulative open interest is used to define the value area.
Example: 70% means the smallest range of prices that contains 70% of total OI in that bar will be marked.
Helps identify zones of interest, support/resistance, and institutional levels.
The image above explains how to identify the VAH/VAL/POC shown by Open Interest Footprint IQ.
VAH = Upper 🞂
POC = ●
VAL = Lower 🞂
Imbalances
Imbalance Percentage
Defines the minimum delta % required at a level to be marked as an imbalance.
If the net open interest change at a level exceeds this threshold, a visual marker appears.
Stacked Imbalance Count
If the number of consecutive imbalance levels meets this count, a “Stacked Imbalance” alert will trigger.
This can signal aggressive buying or selling pressure, potential breakout zones, or institutional absorption.
Color Settings
Longs Opened / Closed, Shorts Opened / Closed
Customize the color palette for each order flow behavior.
These colors appear in the background gradient of the footprint boxes.
Up/Down Only Mode
Toggle to override all behavior-based colors with a single Up Color and Down Color.
Useful if you prefer a simple bull/bear view.
Up Color / Down Color
If "Up/Down Only" is enabled, these two colors are used to represent all net positive or negative deltas.
Special Notes
Crypto only: This script works only with crypto tickers on TradingView.
For other assets (stocks, futures), a warning message will appear instead.
OI data must be available from the exchange (many perpetual pairs support this).
If the footprint is too small or invisible, increase your tick level spacing in the settings.
Alerts
When a stacked imbalance is detected, an alert is fired ("Stacked Imbalance").
This feature is useful for automated systems, bots, or simply staying informed of potential trade setups.
And that's all for now!
If you have any questions or features you'd like to see feel free to share them in the comments below!
Thank you traders!

Institutional Volume Profile# Institutional Volume Profile (IVP) - Advanced Volume Analysis Indicator
## Overview
The Institutional Volume Profile (IVP) is a sophisticated technical analysis tool that combines traditional volume profile analysis with institutional volume detection algorithms. This indicator helps traders identify key price levels where significant institutional activity has occurred, providing insights into market structure and potential support/resistance zones.
## Key Features
### 🎯 Volume Profile Analysis
- **Point of Control (POC)**: Identifies the price level with the highest volume activity
- **Value Area**: Highlights the price range containing a specified percentage (default 70%) of total volume
- **Multi-Row Distribution**: Displays volume distribution across 10-50 price levels for detailed analysis
- **Customizable Period**: Analyze volume profiles over 10-500 bars
### 🏛️ Institutional Volume Detection
- **Pocket Pivot Volume (PPV)**: Detects bullish institutional buying when up-volume exceeds recent down-volume peaks
- **Pivot Negative Volume (PNV)**: Identifies bearish institutional selling when down-volume exceeds recent up-volume peaks
- **Accumulation Detection**: Spots potential accumulation phases with high volume and narrow price ranges
- **Distribution Analysis**: Identifies distribution patterns with high volume but minimal price movement
### 🎨 Visual Customization Options
- **Multiple Color Schemes**: Heat Map, Institutional, Monochrome, and Rainbow themes
- **Bar Styles**: Solid, Gradient, Outlined, and 3D Effect rendering
- **Volume Intensity Display**: Visual intensity based on volume magnitude
- **Flexible Positioning**: Left or right side profile placement
- **Current Price Highlighting**: Real-time price level indication
### 📊 Advanced Visual Features
- **Volume Labels**: Display volume amounts at key price levels
- **Gradient Effects**: Multi-step gradient rendering for enhanced visibility
- **3D Styling**: Shadow effects for professional appearance
- **Opacity Control**: Adjustable transparency (10-100%)
- **Border Customization**: Configurable border width and styling
## How It Works
### Volume Distribution Algorithm
The indicator analyzes each bar within the specified period and distributes its volume proportionally across the price levels it touches. This creates an accurate representation of where trading activity has been concentrated.
### Institutional Detection Logic
- **PPV Trigger**: Current up-bar volume > highest down-volume in lookback period + above volume MA
- **PNV Trigger**: Current down-bar volume > highest up-volume in lookback period + above volume MA
- **Accumulation**: High volume + narrow range + bullish close
- **Distribution**: Very high volume + minimal price movement
### Value Area Calculation
Starting from the POC, the algorithm expands both upward and downward, adding volume until reaching the specified percentage of total volume (default 70%).
## Configuration Parameters
### Profile Settings
- **Profile Period**: 10-500 bars (default: 50)
- **Number of Rows**: 10-50 levels (default: 24)
- **Profile Width**: 10-100% of screen (default: 30%)
- **Value Area %**: 50-90% (default: 70%)
### Institutional Analysis
- **PPV Lookback Days**: 5-20 periods (default: 10)
- **Volume MA Length**: 10-200 periods (default: 50)
- **Institutional Threshold**: 1.0-2.0x multiplier (default: 1.2)
### Visual Controls
- **Bar Style**: Solid, Gradient, Outlined, 3D Effect
- **Color Scheme**: Heat Map, Institutional, Monochrome, Rainbow
- **Profile Position**: Left or Right side
- **Opacity**: 10-100%
- **Show Labels**: Volume amount display toggle
## Interpretation Guide
### Volume Profile Elements
- **Thick Horizontal Bars**: High volume nodes (strong support/resistance)
- **Thin Horizontal Bars**: Low volume nodes (weak levels)
- **White Line (POC)**: Strongest support/resistance level
- **Blue Highlighted Area**: Value Area (fair value zone)
### Institutional Signals
- **Blue Triangles (PPV)**: Bullish institutional buying detected
- **Orange Triangles (PNV)**: Bearish institutional selling detected
- **Color-Coded Bars**: Different colors indicate institutional activity types
### Color Scheme Meanings
- **Heat Map**: Red (high volume) → Orange → Yellow → Gray (low volume)
- **Institutional**: Blue (PPV), Orange (PNV), Aqua (Accumulation), Yellow (Distribution)
- **Monochrome**: Grayscale intensity based on volume
- **Rainbow**: Color-coded by price level position
## Trading Applications
### Support and Resistance
- POC acts as dynamic support/resistance
- High volume nodes indicate strong price levels
- Low volume areas suggest potential breakout zones
### Institutional Activity
- PPV above Value Area: Strong bullish signal
- PNV below Value Area: Strong bearish signal
- Accumulation patterns: Potential upward breakouts
- Distribution patterns: Potential downward pressure
### Market Structure Analysis
- Value Area defines fair value range
- Profile shape indicates market sentiment
- Volume gaps suggest potential price targets
## Alert Conditions
- PPV Detection at current price level
- PNV Detection at current price level
- PPV above Value Area (strong bullish)
- PNV below Value Area (strong bearish)
## Best Practices
1. Use multiple timeframes for confirmation
2. Combine with price action analysis
3. Pay attention to volume context (above/below average)
4. Monitor institutional signals near key levels
5. Consider overall market conditions
## Technical Notes
- Maximum 500 boxes and 100 labels for optimal performance
- Real-time calculations update on each bar close
- Historical analysis uses complete bar data
- Compatible with all TradingView chart types and timeframes
---
*This indicator is designed for educational and informational purposes. Always combine with other analysis methods and risk management strategies.*

TICK+ [Pt]█ TICK+ – Advanced US Market Internals & TICK Distribution Tool
TICK+ is a comprehensive indicator that decodes US market internals by leveraging the TICK index—the net difference between stocks ticking up and those ticking down. Unlike many standard TICK tools that only plot raw values, TICK+ provides multiple visualization modes, dynamic moving averages, an independent MA Ribbon, a detailed distribution profile, divergence and pivot analysis, and real-time data tables. This integrated approach offers both visual and quantitative insights into intraday market breadth, trend sustainability, and potential reversals—making it an indispensable tool for trading US indices, futures, and blue‑chip stocks.
Market internals enthusiasts often consider the TICK index indispensable for trading these markets. By offering an immediate snapshot of sentiment and confirming trends through additional analytics, TICK+ gives traders a decisive edge—helping to determine whether a rally is truly supported by broad participation or if caution is warranted.
--------------------------------------------------------------------------------------------------------
█ Key Features:
► Market Internal – Multiple Display Modes:
Line Mode: Plots the TICK index as a continuous line for a clear view of real‑time values and trend direction.
Bar Mode: Uses traditional bar charts to represent the TICK index, emphasizing the magnitude of changes.
Heikin Ashi Mode: Applies the Heikin Ashi technique to smooth out fluctuations, making the underlying trend easier to discern.
Iceberg TICK Mode: Fills the area between zero and the highs in green, and between zero and the lows in red—highlighting how long the market remains in positive versus negative territory.
How It Works & Usage:
These display modes enable traders to select the visualization that best fits their analysis style. For instance, Iceberg TICK Mode highlights the duration of market strength or weakness, a critical factor for intraday directional assessment.
Comparison of Display Modes
► Dual Moving Average – Fast & Slow:
Computes two moving averages on the TICK index:
• Fast MA – reacts quickly to recent changes.
• Slow MA – confirms the overall trend.
Crossovers provide clear signals:
• Fast MA crossing above the slow MA indicates rising bullish momentum.
• Fast MA crossing below the slow MA indicates increasing bearish pressure.
How It Works & Usage:
These dual moving averages assist in detecting momentum shifts. Crossover signals can be used to time entries and exits to align with prevailing market sentiment.
Dual MA Crossover Example
► Moving Average / Smoothed MA – Smoothed & Base Moving Averages:
Calculates a Base MA and a Smoothed MA on the TICK index to reduce short‑term volatility.
Helps clarify the prevailing trend, providing additional confirmation alongside the dual moving averages.
How It Works & Usage:
These averages filter out noise and offer extra validation of the current trend, enhancing the reliability of trading signals.
Base and Smoothed MA Example
► Moving Average Ribbon – MA Ribbon:
Independently plots several moving averages together as a “ribbon,” each line customizable in length and type.
Visually reflects overall market directional strength:
• Consistent green color indicate sustained bullish conditions.
• Uniform red color indicate prevailing bearish sentiment.
How It Works & Usage:
The MA Ribbon provides a layered perspective on market internals. It enables traders to quickly gauge the robustness of a trend or identify early signs of a potential reversal.
MA Ribbon Trend and Shading
► Divergence - Pivot based – Divergence & Pivot Analysis:
Integrates divergence detection with pivot-based trendline analysis.
Identifies instances when the TICK index and price action diverge, serving as an early warning of a weakening trend.
How It Works & Usage:
Divergence signals help refine trade entries and exits by indicating potential trend reversals or adjustments in market sentiment.
Divergence Analysis
► TICK Distribution Profile – TICK Distribution Profile:
Divides the TICK index range into multiple bins to create a profile of how TICK values are distributed.
Identifies the point of control—the level where most TICK readings concentrate—relative to zero.
Allows adjustment of the lookback period to detect shifts in market bias, such as a move from a neutral zone toward extreme levels.
How It Works & Usage:
By visualizing the distribution of TICK readings, traders can monitor changes in market internals that may precede significant trend changes.
TICK Distribution Profile
► ZigZag – ZigZag:
Applies a zigzag algorithm to filter out minor fluctuations and identify significant swing highs and lows.
Highlights trend extremities and potential reversal points.
Offers an optional extension to the last bar for dynamic trend tracking.
How It Works & Usage:
The ZigZag feature helps traders focus on the major price swings that define market structure, eliminating the noise of insignificant movements.
ZigZag Example
► Pivot Trendline – Pivot Trendline:
Draws trendlines connecting pivot highs and pivot lows.
Provides settings to display only the most recent trendline or extend the last trendline.
Assists in identifying evolving support and resistance levels.
How It Works & Usage:
Pivot trendlines offer clear visual cues for key price levels and potential reversal zones, aiding in the timing of trades.
Pivot Trendline Example
► TICK Levels – TICK Levels:
Defines key thresholds for the TICK index, including neutral levels, trend zones, and overbought/oversold (OB/OS) extremes.
Highlights these levels to assist in identifying conditions that may trigger caution or present opportunities.
How It Works & Usage:
Marking these levels provides an immediate reference for assessing when the TICK index enters critical zones, guiding risk management and trade planning.
TICK Levels
► Background Color – Background Color:
Optionally changes the chart background based on TICK or moving average thresholds.
Provides additional visual cues regarding shifts in market sentiment.
How It Works & Usage:
Background color changes help reinforce key signals by immediately indicating shifts in market internals, enhancing overall situational awareness.
Background Color Example
► Data Tables – Data Table:
Displays essential market data in a single, easy-to-read table, including the TICK index source, market sentiment (e.g. Bullish, Bearish, or Neutral), trend status (such as Accelerating ⇗ or Retracing ⇘), and the current TICK value with color-coded strength.
Consolidates numerical data for a quick and precise assessment of market internals.
How It Works & Usage:
The data tables provide live, numerical feedback that complements the visual analysis, making it easy to monitor market sentiment and trend changes at a glance.
Data Table Display with Metrics
--------------------------------------------------------------------------------------------------------
█ Customization & Input Flexibility:
TICK+ offers extensive input options organized into feature‑specific groups, enabling traders to tailor the tool to various strategies:
► Market Internals Group:
Selects the primary TICK index source (with an optional custom override).
Provides a choice of display modes (Line, Bar, Heikin Ashi, Iceberg TICK) with configurable color schemes.
Includes options for iceberg overlays and highlighting.
► Moving Averages Groups (Dual, Smoothed/Base, MA Ribbon):
Dual MA group: Settings for fast and slow moving averages, including type, length, color, and crossover alerts.
Smoothed/Base MA group: Additional methods to filter out short‑term noise and confirm trends.
MA Ribbon group: Independently plots multiple moving averages as a ribbon, with full customization for each line.
► Divergence & Profile Groups:
Includes inputs for divergence detection (source, pivot lookback) and customization of the TICK Distribution Profile (lookback period, color thresholds, layout details).
► ZigZag & Pivot Trendline Groups:
Allows customization of zigzag parameters to highlight trend extremities.
Provides settings for pivot trendline appearance and behavior.
► TICK Levels & Background Colors:
Defines thresholds for neutral, trend, and extreme levels.
Offers color selections for level markers and optional background shading.
► Data Table Configuration:
Enables setting of table location, lookback intervals, and font size to present essential TICK metrics in a user‑friendly format.
--------------------------------------------------------------------------------------------------------
█ Additional Insights:
► TICK Index Fundamentals:
Monitors the net difference between stocks ticking up and down.
A positive reading indicates broader market participation, while a negative reading suggests increased selling pressure.
Understanding how long the TICK stays above or below zero is crucial for gauging intraday momentum.
► Role of Moving Averages:
Smooth out short‑term fluctuations, helping to highlight the prevailing trend.
Crossovers between fast and slow MAs can serve as clear signals for market momentum shifts.
► Interpreting the MA Ribbon:
Provides a layered perspective on market direction.
Consistent color and alignment confirm a strong trend, while variations may hint at reversals.
► Utility of the Distribution Profile:
Breaks down the TICK index into bins, identifying the point of control.
Changes in this control zone—particularly over different lookback periods—can signal potential trend changes.
► Precision of Data Tables:
Supplies live numerical feedback on key market internals, ensuring trading decisions are based on precise, real‑time measurements.
► Comparative Advantage:
Unlike many TICK tools that simply plot raw values, TICK+ provides an integrated, multidimensional analysis of market internals.
Its advanced features—ranging from unique display modes to sophisticated analytical components—make it indispensable for trading US indices, futures, and blue‑chip stocks.
--------------------------------------------------------------------------------------------------------
Disclaimer
This indicator is provided for educational and research purposes only and does not constitute financial advice. Trading involves risk, and thorough testing on historical data is recommended before applying any strategy using TICK+ in live markets.

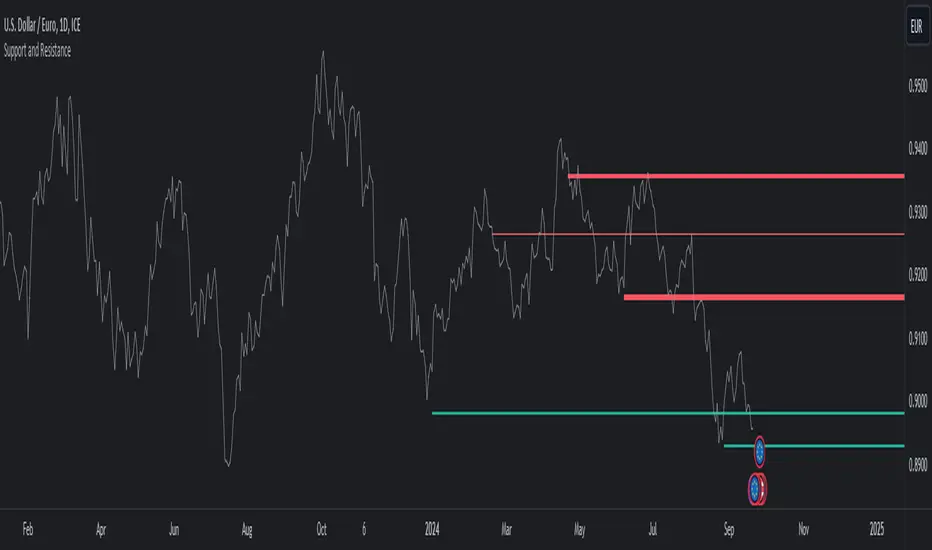
Support and ResistanceThis indicator, titled "Support and Resistance," is designed to identify and display key price levels based on volume and pivot points. It's a versatile tool that can be adapted for different market views and timeframes.
Key Features
Market View Options
The indicator offers three market view settings:
Short term
Standard
Long term
These settings affect the lookback periods used in calculations, allowing users to adjust the indicator's sensitivity to market movements.
Volume-Based Levels
The indicator calculates support and resistance levels using a rolling Point of Control (POC) derived from volume data. This approach helps identify price levels where the most trading activity has occurred.
Pivot Points
In addition to volume-based levels, the indicator incorporates pivot points to identify potential support and resistance areas.
Customizable Appearance
Users can adjust:
Number of lines to display (1-8)
Colors for support and resistance levels
Line thickness based on level importance
Calculation Methods
Rolling POC
The indicator uses a custom function f_rolling_poc to calculate the rolling Point of Control. This function analyzes volume distribution across price levels within a specified lookback period.
Pivot Points
Both standard and quick pivot points are calculated using the rolling POC as input, rather than traditional price data.
Level Importance
The indicator assigns importance to each level based on:
Number of touches (how often price has interacted with the level)
Duration (how long the level has been relevant)
This importance score determines the thickness of the displayed lines.
Unique Aspects
Dynamic Line Thickness: Lines become thicker when levels overlap, highlighting potentially stronger support/resistance areas.
Adaptive Coloring: The color of each line changes dynamically based on whether the current price is above or below the level, indicating whether it's acting as support or resistance.
Flexible Time Frames: The market view options allow the indicator to be easily adapted for different trading styles and timeframes.
Potential Uses
This indicator could be valuable for:
Identifying key price levels for entry and exit points
Recognizing potential breakout or breakdown levels
Understanding the strength of support and resistance based on line thickness
Adapting analysis to different market conditions and timeframes
Overall, this "Support and Resistance" indicator offers a sophisticated approach to identifying key price levels, combining volume analysis with pivot points and providing visual cues for level importance and current market position.
This Support and Resistance indicator is provided for informational and educational purposes only. It should not be considered as financial advice or a recommendation to buy or sell any security. The indicator's calculations are based on historical data and may not accurately predict future market movements. Trading decisions should be made after thorough research and consultation with a licensed financial advisor. The creator of this indicator is not responsible for any losses incurred from its use. Past performance does not guarantee future results. Use at your own risk.
EM Visible Range Volume Profile█ OVERVIEW
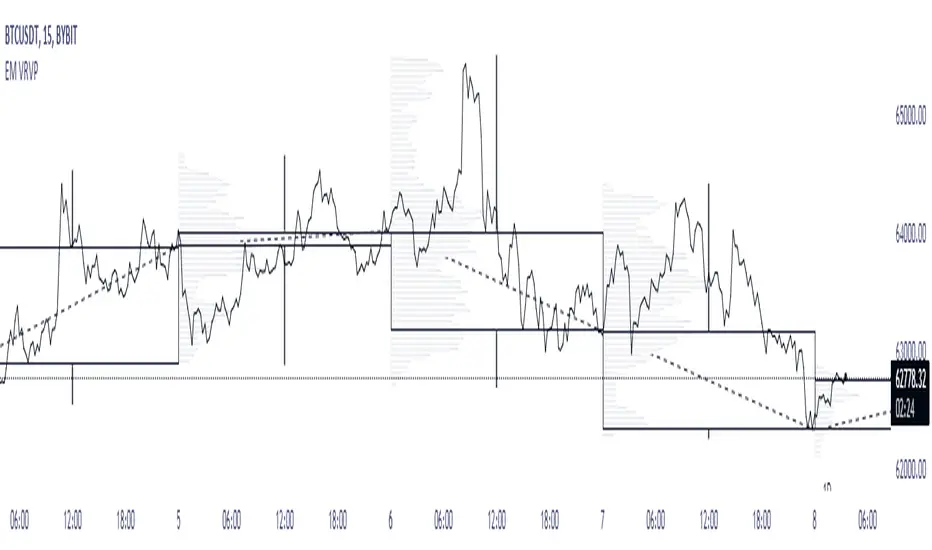
ᴇᴍ VRVP (Visible Range Volume Profile) indicator calculates the volume profile within the visible range of prices.
Volume Profile is an advanced technical analysis indicator that shows trading activity over a specified period of time at certain price levels.
The indicator plots a histogram on the chart that reflects dominant or significant price levels based that are based on volume.
VP concept
VP Components
Open, High, Low, Close:
There are different types of volume profile indicators but the majority of them will designate the OHLC.
Point of Control:
A price level with the most traded volume during one session, also known as POC.
High Volume Node (HVN):
Area of high volume relative to surrounding price action.
Low Volume Node (LVN):
Area of low volume relative to surrounding price action.
Analysis of price in relation to high and low volume nodes is useful when building context around your trades.
█ VOLUME PROFILE STRATEGIES
The distribution of a volume profile can help you determine the strength of a trend and spot potential reversal zones. Let’s take a look at the five different distribution types.
Neutral D
In order for price to break away from value, either the buyers or the sellers will have to become more aggressive than the other side. When this occurs, it gives us with a vital piece of information.
Now we know who were the agressors at this price level: either the buyers or the sellers. That's why this is a good level for a trading setup if the price bounces back.
Bearish P and Bullish P
Bearish P — reversal. Bullish P — confirmation.
Bearish Ь and Bullish Ь
Bearish Ь — confirmation. Bullish Ь — reversal.
Examples
█ INPUTS
Width — amplitude of the VP histogram.
Grid — the number of columns of the VP histogram.
Delta of volumes — combinatorial determination of the ratios of sellers and buyers.
In quoted units — conversion in units of quoted currency.
Logarithmic scale — recalculation the grid step to the logarithmic scale of the chart.
HTF — (Higher Timeframe) calculation of VP for the period of the selected timeframe. ISO: Isolated computation in HTF period.
Palette: Total volume, Volume of buyers, Volume of sellers, HTF bars.
Warnings: colour of the «⚠» icon, language of information in the Tooltip.
Addition: ᴇᴍ CHN-RMA — a grid of moving averages with periods of centered hexagonal numbers.
█ ОБЩИЕ СВЕДЕНИЯ
ᴇᴍ VRVP (Visible Range Volume Profile) рассчитывает профиль объёма в видимом диапазоне цен.
Профиль объёма — это продвинутый индикатор технического анализа, который показывает торговую активность за условленный период времени на определённых ценовых уровнях.
Индикатор строит на графике гистограмму, отражающую доминирующие или значимые ценовые уровни, основанные на объёме.
█ НАСТРОЙКИ
Ширина — амплитуда гистограммы VP.
Сетка — количество колонок гистограммы VP.
Дельта объёмов — комбинаторное определение соотношений продаж и покупок.
В котируемых единицах — пересчёт в единицах котируемой валюты.
Логарифмическая шкала — пересчёт шага сетки на логарифмическую шкалу графика.
HTF — (Higher Timeframe) расчёт VP за период выбранного таймфрейма. ISO: Изолированное вычисление в HTF-периоде.
Палитра: Суммарный объём, Объём покупок, Объём продаж, Бары HTF.
Предупреждения: цвет значка «⚠», язык информации в Tooltip.
Дополнение: ᴇᴍ CHN-RMA — сетка скользящих средних с периодами центрированных гексагональных чисел.
Volume Profile PlusThis indicator provides a high-resolution and high-precision implementation of Volume Profile with flexible range settings. Its key features include:
1. Support for a high resolution of up to 2,500 rows.
2. Capability to examine lower timeframe bars (default 5,000 intra-bars) for enhanced precision.
3. Three range modes — "Visible Range", "Anchored Range", and "All Range".
4. Highlighting of Point of Control and Value Area.
5. Extensive customization options allowing users to configure dimensions, on-chart placements, and color schemes.
🔵 Settings
The settings screen, along with the explanations for each setting, is provided below:
🔵 High Resolution using Polyline
Inspired by @fikira, this indicator utilizes the newly introduced `polyline` type in PineScript to plot the volume profile. It employs a single polyline instance to represent the entire histogram. With each polyline instance supporting up to 10,000 points and each histogram row requiring 4 points, this indicator can accommodate 2500 rows, resulting in a significantly higher resolution compared to conventional volume profile indicators that use `line`s or `box`es to draw the histogram.
🔵 High Precision Data-binning using Lower Timeframe Data
Conventional volume profile indicators often face one or both of the following limitations:
1. They only consider volume within the chart's current timeframe.
2. They assign each bar's total volume to a single price bucket based on the bar's average price, rather than distributing volume across multiple price buckets.
As a result, when the number of bars in the chart is low, those indicators may provide imprecise results, making it difficult to accurately identify significant volume nodes and the point of control.
To address these limitations and enhance accuracy, this indicator examines data from lower timeframes and distributes the volume to fine-grained price buckets. It intelligently selects an appropriate lower timeframe to ensure precise output while complying with a maximum specified number of bars to maintain good performance.
🔵 Three Range Modes
This indicator offers users the flexibility to choose from three range modes:
1. Visible Range (Default Mode): In this mode, the volume profile calculation begins at the time of the left-most bar displayed in the current viewport. As the user scrolls through the viewport, the volume profile updates automatically.
2. Anchored Range: This mode allows the user to set the start time either by using the datetime input boxes or by dragging the anchor line on the chart.
3. All Range: In this mode, the volume profile calculation is based on all the historical bars available in the chart.

BE - Spread_IndicatorSpread Indicator: An Overview Driven by the concept of forethought. The indicator predicts the range for the day and divides it into two or three Levels (upper, middle, and lower).
These ranges are drawn from possible supply and demand zones as well as potential price consolidation zones which has happend in the rolling number of days in the past.
It's true that market respects history. Which means the zones which are untested and created new in recent past shall be respected in the future days. Also the most respected Zones switch between support and resistance based on the price and volume pumped into the market.
Calucations Involved In the Indicator:
Indicator takes into account Factrol points, Fibonachi and its Retracements along with Channel and Candle Ranges to calculate the levels accordingly.
Levels Information:
Levels should be Treated and Traded the way like POC (Point Of Control). Price within the levels are basically controled by the levels above and underneath.
Converting idea to TradeOpportunity:
One can look into deploying IronCondor, while it is within the Zone also One Can deploy Long Straddle when the levels are Tested.
My personal Observation not a Trade Recommendation
With an Option Buyer view, I have been testing this indicator on the Index (BankNifty, FinNifty & Nifty) on 5 Min TF and 15 Min TF. Banknifty Works Well with Bull & Bear Spreads and FinNifty along with Nifty Works Well with Long Straddle & Long Strangle.
Happy to receive Suggesstions and feedback to improvise it with better option strategy.
Features:
1. Integrated with NLB for AlgoTrading.
2. Timely Alerts for Levels, Formation, Breach, TestOf Levels, CrossOvers.
3. Position Can be traded as CarryForward or Intraday.

Visible Range Mean Deviation Histogram [LuxAlgo]This script displays a histogram from the mean and standard deviation of the visible price values on the chart. Bin counting is done relative to high/low prices instead of counting the price values within each bin, returning a smoother histogram as a result.
Settings
Bins Per Side: Number of bins computed above and below the price mean
Deviation Multiplier: Standard deviation multiplier
Style
Relative: Determines whether the bins length is relative to the maximum bin count, with a length controlled with the width settings to the left.
Bin Colors: Bin/POC Lines colors
Show POCs: Shows point of controls
Usage
Histograms are generally used to estimate the underlying distribution of a series of observations, their construction is generally done taking into account the overall price range.
The proposed histogram construct N intervals above*below the mean of the visible price, with each interval having a size of: σ × Mult / N , where σ is the standard deviation and N the number of Bins per side and is determined by the user. The standard deviation multipliers are highlighted at the left side of each bin.
A high bin count reflects a higher series of observations laying within that specific interval, this can be useful to highlight ranging price areas.
POCs highlight the most significant bins and can be used as potential support/resistances.

BB Breakout [DemaK] BB Breakout is a volatility and intrabar activity indicator that combines Bollinger Band breakout context with an internal candle Point of Control (POC) derived from lower-timeframe data.
The indicator is designed to help traders identify expansion phases, price acceptance outside statistical ranges, and where volume concentrated inside each candle during those conditions.
Bollinger Breakout Context
The script plots a standard Bollinger Band structure and highlights conditions where price moves outside the upper or lower band. When this occurs:
The chart background is shaded to visually mark bullish or bearish breakout zones.
These zones help identify moments of increased volatility or directional pressure.
The Bollinger Bands serve as a statistical volatility framework, providing context rather than trade signals.
Candle POC Overlay
In addition to the breakout zones, the indicator plots a single price level per candle representing the candle’s internal Point of Control.
This level is derived from lower-timeframe price and volume behavior and highlights the price where the strongest participation occurred during the formation of the candle. The POC offers insight into:
Intrabar balance and imbalance
Areas of acceptance within high-volatility conditions
Potential short-term reaction levels
Optional labels can display basic volume and delta-related information for traders who want additional context.
How to use it
Use Bollinger breakout zones to identify volatility expansion.
Observe how price interacts with the candle POC during and after breakouts.
Combine both elements to assess whether breakouts show acceptance or rejection at key intrabar levels.
Notes
The indicator does not include VWAP calculations.
Lower-timeframe data availability may affect precision depending on symbol and exchange.
BB Breakout is intended as a contextual analysis tool, not a signal generator. It provides structured visual information that allows traders to interpret price behavior during volatility expansions using their own trading approach.

Candle POC [DemaK]Candle POC is a volume-based indicator that identifies the Point of Control (POC) inside each candle by analyzing lower-timeframe volume distribution. Instead of assuming that volume is evenly distributed across the candle range, this script reconstructs how volume behaved internally using lower timeframe data.
How it works
For every higher-timeframe candle, the indicator requests data from a lower timeframe and separates volume into:
Buy volume (candles closing above open)
Sell volume (candles closing below open)
Neutral volume (candles closing equal to open)
The script then:
Aggregates bullish and bearish volume within the candle.
Calculates volume delta (buy volume minus sell volume).
Normalizes the delta relative to total volume.
Locates the price level where the strongest volume imbalance occurred, which is treated as the candle’s Point of Control.
This POC represents the price level where market participation was most aggressive during the candle, highlighting areas of acceptance or rejection.
What is plotted
A single price level per candle representing the internal volume POC.
Optional detailed labels showing:
Total volume
Volume delta
Delta percentage relative to total volume
How to use it
The Candle POC can act as a short-term support or resistance level.
It is useful for identifying intracandle balance zones, absorption, and momentum shifts.
Traders can combine it with price action or market structure to confirm entries, exits, or areas of interest.
Notes
The indicator always uses lower-timeframe data to improve precision.
Results depend on the availability and quality of lower-timeframe volume data provided by the symbol and exchange.

AR-Volume ProfileAR-Volume Profile plots two volume profiles on your chart at the same time:
• Daily Volume Profiles (multiple days back, always visible)
• Hourly Volume Profiles (last N hours, designed for ≤ 15m timeframes)
It’s built to stay clean, readable, and performance-safe, while still letting you see where volume built up across recent structure.
________________________________________
What You See On Chart
- Daily Profiles (Multi-day) Increased using Polylines
• Shows Volume Profile histograms for the last X days back (you choose).
• Each day is drawn as a horizontal histogram inside that day’s session.
• Color logic:
o Base (all volume)
o Value Area (VA)
o POC (Point of Control)
- Daily Levels (POC / VAH / VAL)
• Adds optional horizontal levels:
o POC
o VAH
o VAL
• You can choose whether to draw these:
o Today only, or
o Past days too (if enabled in your version)
• Levels can optionally extend to the right to act like HTF references.
- Hourly Profiles (Intraday context)
• Shows profiles for the last N hours (you choose).
• Meant to be used on 15m and below for clean intraday mapping.
• Optional hourly level lines are available too.
________________________________________
How It Calculates Volume
This is a bar-based approximation of a volume profile:
• Each candle’s volume is distributed across its price range based on overlap with bins.
• Flat candles (very small range) are placed into the nearest bin.
• This gives a reliable “where volume accumulated” view without needing exchange order-by-order data.
________________________________________
Key Inputs Explained
Daily Profile (Always Visible)
• Days back to show (Daily)
How many previous daily profiles you want displayed.
• Daily bins
Higher bins = more detail (but higher object usage).
• Daily Value Area %
Default 70% like traditional VP.
• Daily profile width (% of day)
Controls how wide the histogram is inside the day.
• Daily profile side
Left or Right inside each day.
• Show Daily POC/VAH/VAL lines
Enable level lines.
• Extend Daily levels to the right
Makes daily levels act like forward HTF liquidity/targets.
Hourly Profile (15m and below)
• How many hours
Number of hourly profiles to display.
• Hourly bins
• Hourly profile width (% of hour)
• Hourly profile side
• Show Hourly POC/VAH/VAL lines
________________________________________
Best Use Cases
- Intraday trading (scalping + day trading)
- Mapping premium/discount volume build-ups
- Pairing with:
• liquidity sweeps
• order blocks
• HTF levels
• session ranges
• breaker / mitigation concepts
________________________________________
Recommended Settings (Practical)
If you want more daily history, you must balance line budget.
Example setups:
“Clean Daily Focus” (more days)
• Daily bins: 60–80
• Days back: 10–20
• Hours: 0–4 (or lower)
• Budget mode: Daily First
“Intraday Heavy” (more hourly detail)
• Hourly bins: 30–50
• Hours: 8–12
• Days back: 3–7
• Budget mode: Hourly First
________________________________________
Notes / Limitations
• Hourly profiles are designed for ≤ 15m timeframes.
• This uses approximate volume distribution from candle ranges (not exchange tick VP).
• If volume data is missing on the symbol/broker, results will be less meaningful.
• Visual output depends on instrument liquidity + chart zoom.

HTF Frequency Zone [BigBeluga]🔵 OVERVIEW
HTF Frequency Zone highlights the dominant price level (Point of Control) and the full high–low expansion of any higher timeframe — Daily, Weekly, or Monthly. It captures the frequency of closes inside each HTF candle and plots the most traded “frequency zone”, allowing traders to easily see where price spent the most time and where buy/sell pressure accumulated.
This tool transforms each higher-timeframe bar into a fully visualized structure:
• Top = HTF high
• Bottom = HTF low
• Midline = HTF Frequency POC
• Color-coded zones = bullish or bearish bias
• Labels = counts of bullish and bearish candles inside the HTF range
It is designed to give traders an immediate understanding of high-timeframe balance, imbalance, and price attraction zones.
🔵 CONCEPTS
HTF Partitioning — Each Weekly/Daily/Monthly candle is converted into a dedicated zone with its own High, Low, and Frequency Point of Control.
Frequency POC (Most Touched Price) — The indicator divides the HTF range into 100 bins and counts how many times price closed near each level.
Dominant Zone — The level with the highest frequency becomes the HTF “Value Zone,” plotted as a bold central line.
Directional Bias —
• Bullish HTF zone
• Bearish HTF zone
Internal Candle Counting — Within each HTF period the indicator counts:
• Buy candles (close > open)
• Sell candles (close < open)
This reveals whether intraperiod flow was bullish or bearish.
HTF Structure Blocks — High, Low, and POC are connected across the entire higher-timeframe duration, showing the real shape of HTF balance.
🔵 FEATURES
Automatic HTF Zone Construction — Generates a complete price zone every time the selected timeframe flips (Daily / Weekly / Monthly).
Dynamic High & Low Extraction — The indicator scans every bar inside the HTF window to find true extremes of the range.
100-Level Frequency Scan — Each close within the period is assigned to a bin, creating a detailed distribution of price interaction.
HTF POC Highlighting — The most frequent price level is plotted with a bold red line for immediate visual clarity.
Bull/Bear Coloring —
• Green → Bullish HTF zone.
• Orange → Bearish HTF zone.
Zone Shading — High–Low range is filled with a semi-transparent color matching trend direction.
Buy/Sell Candle Counters — Printed at the top and bottom of each HTF block, showing how many internal candles were bullish or bearish.
POC Label — Displays frequency count (how many touches) at the POC level.
Adaptive Threshold Warning — If bars inside the HTF window are too few (<10), the indicator warns the trader to switch timeframe.
🔵 HOW TO USE
Higher-Timeframe Biasing — Read the zone color to determine if the HTF candle leaned bullish or bearish.
Value Zone Reactions — Price often reacts to the Frequency POC; use it as support/resistance or liquidity magnet.
Range Context — Identify when price is trading near HTF highs (breakout potential) or lows (reversal potential).
Momentum Evaluation — More bullish internal candles = internal buying pressure; more bearish = internal selling pressure.
Swing Trading — Use HTF zones as the “macro map,” then execute trades on lower timeframes aligned with the zone structure.
Liquidity Awareness — The HTF POC often aligns with algorithmic liquidity levels, making it a strong reaction point.
🔵 CONCLUSION
HTF Frequency Zone transforms raw higher-timeframe candles into detailed distribution zones that reveal true market behavior inside the HTF structure. By showing highs, lows, buying/selling activity, and the most interacted price level (Frequency POC), this tool becomes invaluable for traders who want to align executions with powerful HTF levels, liquidity magnets, and structural zones.

Volume Area 80 Rule Pro - Adaptive RTHSummary in one paragraph
Adaptive value area 80 percent rule for index futures large cap equities liquid crypto and major FX on intraday timeframes. It focuses activity only when multiple context gates align. It is original because the classic prior day value area traverse is fused with a daily regime classifier that remaps the operating parameters in real time.
Scope and intent
• Markets. ES NQ SPY QQQ large cap equities BTC ETH major FX pairs and other liquid RTH instruments
• Timeframes. One minute to one hour with daily regime context
• Default demo used in the publication. ES1 on five minutes
• Purpose. Trade only the balanced days where the 80 percent traverse has edge while standing aside or tightening rules during trend or shock
Originality and usefulness
• Unique fusion. Prior day value area logic plus a rolling daily regime classifier using percentile ranks of realized volatility and ADX. The regime remaps hold time end of window stop buffer and value area coverage on each session
• Failure mode addressed. False starts during strong trend or shock sessions and weak traverses during quiet grind
• Testability. All gates are visible in Inputs and debug flags can be plotted so users can verify why a suggestion appears
• Portable yardstick. The regime uses ATR divided by close and ADX percent ranks which behave consistently across symbols
Method overview in plain language
The script builds the prior session profile during regular trading hours. At the first regular bar it freezes yesterday value area low value area high and point of control. It then evaluates the current session open location the first thirty minute volume rank the open gap rank and an opening drive test. In parallel a daily series classifies context into Calm Balance Trend or Shock from rolling percentile ranks of realized volatility and ADX. The classifier scales the rules. Calm uses longer holds and a slightly wider value area. Trend and Shock shorten the window reduce holds and enlarge stop buffers.
Base measures
• Range basis. True Range smoothed over a configurable length on both the daily and intraday series
• Return basis. Not required. ATR over close is the unit for regime strength
Components
• Prior Value Area Engine. Builds yesterday value area low value area high and point of control from a binned volume profile with automatic TPO fallback and minimum integrity guards
• Opening Location. Detects whether the session opens above the prior value area or below it
• Inside Hold Counter. Counts consecutive bars that hold inside the value area after a re entry
• Volume Gate. Percentile of the first thirty minutes volume over a rolling sample
• Gap Gate. Percentile rank of the regular session open gap over a rolling sample
• Drive Gate. Opening drive check using a multiple of intraday ATR
• Regime Classifier. Percentile ranks of daily ATR over close and daily ADX classify Calm Balance Trend Shock and remap parameters
• Session windows optional. Windows follow the chart exchange time
Fusion rule
Minimum satisfied gates approach. A re entry must hold inside the value area for a regime scaled number of bars while the volume gap and drive gates allow the setup. The regime simultaneously scales value area coverage end minute time stop and stop buffer.
Signal rule
• Long suggestion appears when price opens below yesterday value area then re enters and holds for the required bars while all gates allow the setup
• Short suggestion appears when price opens above yesterday value area then re enters and holds for the required bars while all gates allow the setup
• WAIT shows implicitly when any required gate is missing
• Exit labels mark target touch stop touch or a time based close
Inputs with guidance
Setup
• Signal timeframe. Uses the chart by default
• Session windows optional. Start and end minutes inside regular trading hours
• Invert direction is not used. The logic is symmetric
Logic
• Hold bars inside value area. Typical range 3 to 12. Raising it reduces trades and favors better traverses. Lowering it increases frequency and risk of false starts
• Earliest minute since RTH open and Latest minute since RTH open. Typical range 0 to 390. Reducing the latest minute cuts late session trades
• Time stop bars after entry. Typical range 6 to 30. Larger values give setups more room
Filters
• Value area coverage. Typical range 0.70 to 0.85. Higher coverage narrows the traverse but accepts fewer days
• Bin size in ticks. Typical range 1 to 8. Larger bins stabilize noisy profiles
• Stop buffer ticks beyond edge. Typical range 2 to 20. Larger buffers survive noise
• First thirty minute volume percentile. Typical range 0.30 to 0.70. Higher values require more active opens
• Gap filter percentile. Typical range 0.70 to 0.95. Lower values block more gap days
• Opening drive multiple and bars. Higher multiple or longer bars block strong directional opens
Adaptivity
• Lookback days for regime ranks. Typical 150 to 500
• Calm RV percentile. Typical 25 to 45
• Trend ADX percentile. Typical 55 to 75
• Shock RV percentile. Typical 75 to 90
• End minute ratio in Trend and Shock. Typical 0.5 to 0.8
• Hold and Time stop scales per regime. Use values near one to keep behavior close to static settings
Realism and responsible publication
• No performance claims. Past results never guarantee future outcomes
• Shapes can move while a bar forms and settle on close
• Sessions use the chart exchange time
Honest limitations and failure modes
• Economic releases and thin liquidity can break the balance premise
• Gap heavy symbols may work better with stronger gap filters and a True Range focus
• Very quiet regimes reduce signal contrast. Consider longer windows or higher thresholds
Legal
Education and research only. Not investment advice. Test in simulation before any live use.

Previous TPOIndicator Summary
This Pine Script indicator, "Previous TPO," is designed to calculate and display five key price levels from the previous trading day's market activity. It uses a 30-minute TPO (Time Price Opportunity) profile, which is a method of organizing price by time to find areas of high and low activity.
The five levels it plots on the current day are:
1. Previous Value Area High (VAH)
2. Previous Value Area Low (VAL)
3. Previous Point of Control (POC)
4. Previous Initial Balance High (IBH)
5. Previous Initial Balance Low (IBL)
The script is built to be efficient, running its main calculation only once at the beginning of each new day. It also includes an automatic line management system to delete old lines, preventing the "Too many lines" error and keeping the chart clean.
How the Code Works
1. Data Collection: At the start of a new day (00:00), the script looks back at the chart's history. It uses request.security to access 30-minute bar data.
2. Collector Loop: It then loops backward, bar by bar, to find and store 48 unique 30-minute High/Low data points, which represents the full 24-hour range of the previous day.
3. TPO Profile: With this 30-minute data, it builds a TPO profile. It divides the previous day's price range into small bins (price levels) and counts how many 30-minute periods "touched" each price bin.
4. Level Calculation:
o POC: It finds the price bin with the highest TPO count (the most traded price) and sets it as the Point of Control.
o VAH/VAL: It starts at the POC and expands outward, adding the next-most-traded price bins until 70% (or the user-defined percentage) of the day's TPOs are included. The highest and lowest prices of this range are the Value Area High and Value Area Low.
o IBH/IBL: It identifies the high and low of the first hour (the first two 30-minute bars) of the previous day to set the Initial Balance High and Initial Balance Low.
5. Drawing: The script draws these five levels as horizontal lines across the current trading day, providing a constant reference.
6. Line Management: It keeps track of all lines in an array. When the total number of lines exceeds the user's limit (e.g., 50 days * 5 lines = 250), it automatically deletes the oldest lines from the chart.
Usefulness for Trading
This indicator provides a powerful framework for intraday traders by contextualizing the current day's price action against the previous day's "auction."
• Key Support/Resistance: The VAH, VAL, and POC act as significant support and resistance lev-els. Price reacting at these levels can signal mean reversion, while acceptance beyond them can signal a trend or expansion day.
• Value Area as Context: Trading inside the previous day's value area (between VAH and VAL) is often seen as "balanced" or "range-bound" trading. Trading outside of it is "unbalanced" or "trending."
• POC as a "Magnet": The POC, being the area of highest volume/time, often acts as a "magnet" or "center of gravity" for price.
• Opening Range: The Initial Balance (IB) levels show the opening range. A breakout from this range is often a key signal for the day's initial direction.
• 80% Rule: The script contains (currently commented-out) setup logic for the "80% Rule." This is a specific Market Profile strategy where:
1. The market opens inside the previous day's Value Area.
2. The Initial Balance fails to extend outside the VA (e.g., in a short setup, the IB high stays below the VAH).
3. This setup suggests an 80% probability that the price will rotate and test the other side of the Value Area (e.g., test the VAL).
Publication and restrictions
This script is published under the Mozilla Public Licence 2.0 (MPL 2.0) and is therefore suitable for publi-cation as an open source indicator on TradingView.
Timeframe limitation: The indicator is designed for intraday timeframes. Timeframes below 10 minutes do not work and lead to an error. Recommended time frame 30 minutes.
It will not work correctly on:
Time frame under 10 minutes: The data collection loop (max_bars_to_check = 3000) is not large enough to collect the bars required for a full day on a 5-minute chart or smaller.
High time frames (e.g. 1H, 4H, Daily): The script's logic is based on a chart timeframe 30-minute data that it requests. If higher time frames are selected, the script works but the zones are no longer correct or become irrelevant.

Dobrusky Volume PulseWhat it does & who it’s for
Volume Pulse is a lightweight, customizable volume profile overlay that shows traders how volume is distributed across price levels over a chosen lookback window. Unlike standard profiles, it also maps cumulative buy/sell pressure at each level, so you see not just where volume clustered, but which side dominated.
Core ideas
Cumulative volume by price: Builds a horizontal profile of traded volume at each level, based on user-defined depth and resolution.
Directional pressure mapping: At every price level, the script accumulates bullish vs. bearish volume based on candle closes vs. opens, providing a directional read on whether buyers or sellers had the upper hand.
POC: Automatically highlights the Point of Control (POC) — the level with the most activity.
Customizable presentation: Adjustable profile resolution, bar width, offset, colors, and whether to show cumulative, directional, or both.
How the components work together
The profile provides the “where,” while the buy/sell mapping adds the “who.” By combining these, traders can see whether a high-volume node was buyer-driven absorption or seller-driven distribution — a distinction classic profiles don’t reveal. This directional overlay reduces the guesswork of interpreting raw volume clusters.
How to use
Apply the overlay to your chart.
Watch the POC and areas of significant increase or decrease in volume (and pressure) as natural magnets or rejection areas.
When trading intraday, I've found that higher timeframe volume levels act as strong magnets. In the chart, you can see the volume levels I've drawn on the SPY daily chart. These levels are targets I use when trading the 5-minute chart.
Pay attention to color dominance at those zones — green-heavy nodes suggest buyer control; red-heavy nodes suggest seller control.
Combine with time-based volume tools and price-action for a more comprehensive trade plan.
Settings overview
Lookback depth: Number of bars used for profile calculation.
Profile resolution: Number of horizontal bars to split volume across price.
Bar style: Width, offset, and multiplier for scaling.
Toggle layers: Choose cumulative, directional, or both.
POC display: Optional highlight of the most traded level.
Limitations & best practices
This is a contextual overlay, not a trade-signal system.
Works best on liquid instruments (indices, futures, major stocks, liquid crypto) where volume distribution is meaningful.
Directional mapping uses candle body bias (close vs. open), not raw order flow. For full tape analysis, pair with actual order flow data.
Originality justification
Dual profile: combines cumulative volume-by-price and buyer/seller pressure per bin (close vs. open) — not a standard VP clone.
From-scratch binning + POC in a single pass for speed; no reused libraries.
Flexible display (cumulative / directional / both) with independent resolution, width, and offset for intraday or HTF use.
Clear visuals (optional POC, balanced node coloring) and open-source code so traders can audit and extend.

Fixed-Range Volume-Profile ZonesFixed Range Volume Profile Zones (with Dynamic Percentile Buffers)
This indicator calculates a fixed‑range volume profile over a user‑defined lookback period and identifies three key zones:
– VAL (Value Area Low)
– POC (Point of Control)
– VAH (Value Area High)
Volume is grouped into user‑selected price bins to create a profile of where the most trading activity occurred.
The script then splits the distribution into three zones and highlights the extremes (VAL/VAH) and the highest‑volume price (POC).
Dynamic Percentile Buffers
Instead of static offsets, this version computes the 10th and 90th percentile prices (user‑adjustable) of recent closes over the same lookback window.
These percentiles are used to create adaptive buffers above VAH and below VAL.
The buffers automatically expand or contract with market volatility and recent price distribution, filtering out weak or noisy touches.
Visual Elements:
– Green/orange/red horizontal lines = VAL / VAH / POC
– Green shading below VAL = buy zone
– Red shading above VAH = sell zone
– Down arrows above bars = closes above VAH + buffer
– Up arrows below bars = closes below VAL – buffer
Inputs:
– Lookback Days: number of bars used to build the profile
– Number of Bins: controls resolution of the volume profile
– VAH Percentile and VAL Percentile: choose which percentile levels to use for dynamic buffers
Use Cases:
– Quickly identify areas of high participation (POC) and potential support/resistance (VAL/VAH)
– Filter out weak breakouts using dynamic buffers
– Combine with other signals to improve entries/exits
⚠️ Disclaimer:
This script is for educational and informational purposes only.
It does not constitute financial advice or a recommendation to buy or sell any security.
Past performance or historical data does not guarantee future results.
Always perform your own analysis and use risk management when trading.

Advanced Volume Profile Pro Delta + POC + VAH/VAL# Advanced Volume Profile Pro - Delta + POC + VAH/VAL Analysis System
## WHAT THIS SCRIPT DOES
This script creates a comprehensive volume profile analysis system that combines traditional volume-at-price distribution with delta volume calculations, Point of Control (POC) identification, and Value Area (VAH/VAL) analysis. Unlike standard volume indicators that show only total volume over time, this script analyzes volume distribution across price levels and estimates buying vs selling pressure using multiple calculation methods to provide deeper market structure insights.
## WHY THIS COMBINATION IS ORIGINAL AND USEFUL
**The Problem Solved:** Traditional volume indicators show when volume occurs but not where price finds acceptance or rejection. Standalone volume profiles lack directional bias information, while basic delta calculations don't provide structural context. Traders need to understand both volume distribution AND directional sentiment at key price levels.
**The Solution:** This script implements an integrated approach that:
- Maps volume distribution across price levels using configurable row density
- Estimates delta (buying vs selling pressure) using three different methodologies
- Identifies Point of Control (highest volume price level) for key support/resistance
- Calculates Value Area boundaries where 70% of volume traded
- Provides real-time alerts for key level interactions and volume imbalances
**Unique Features:**
1. **Developing POC Visualization**: Real-time tracking of Point of Control migration throughout the session via blue dotted trail, revealing institutional accumulation/distribution patterns before they complete
2. **Multi-Method Delta Calculation**: Price Action-based, Bid/Ask estimation, and Cumulative methods for different market conditions
3. **Adaptive Timeframe System**: Auto-adjusts calculation parameters based on chart timeframe for optimal performance
4. **Flexible Profile Types**: N Bars Back (precise control), Days Back (calendar-based), and Session-based analysis modes
5. **Advanced Imbalance Detection**: Identifies and highlights significant buying/selling imbalances with configurable thresholds
6. **Comprehensive Alert System**: Monitors POC touches, Value Area entry/exit, and major volume imbalances
## HOW THE SCRIPT WORKS TECHNICALLY
### Core Volume Profile Methodology:
**1. Price Level Distribution:**
- Divides price range into user-defined rows (10-50 configurable)
- Calculates row height: `(Highest Price - Lowest Price) / Number of Rows`
- Distributes each bar's volume across price levels it touched proportionally
**2. Delta Volume Calculation Methods:**
**Price Action Method:**
```
Price Range = High - Low
Buy Pressure = (Close - Low) / Price Range
Sell Pressure = (High - Close) / Price Range
Buy Volume = Total Volume × Buy Pressure
Sell Volume = Total Volume × Sell Pressure
Delta = Buy Volume - Sell Volume
```
**Bid/Ask Estimation Method:**
```
Average Price = (High + Low + Close) / 3
Buy Volume = Close > Average ? Volume × 0.6 : Volume × 0.4
Sell Volume = Total Volume - Buy Volume
```
**Cumulative Method:**
```
Buy Volume = Close > Open ? Volume : Volume × 0.3
Sell Volume = Close ≤ Open ? Volume : Volume × 0.3
```
**3. Point of Control (POC) Identification:**
- Scans all price levels to find maximum volume concentration
- POC represents the price level with highest trading activity
- Acts as significant support/resistance level
- **Developing POC Feature**: Tracks POC evolution in real-time via blue dotted trail, showing how institutional interest migrates throughout the session. Upward POC migration indicates accumulation patterns, downward migration suggests distribution, providing early trend signals before price confirmation.
**4. Value Area Calculation:**
- Starts from POC and expands up/down to encompass 70% of total volume
- VAH (Value Area High): Upper boundary of value area
- VAL (Value Area Low): Lower boundary of value area
- Expansion algorithm prioritizes direction with higher volume
**5. Adaptive Range Selection:**
Based on profile type and timeframe optimization:
- **N Bars Back**: Fixed lookback period with performance optimization (20-500 bars)
- **Days Back**: Calendar-based analysis with automatic timeframe adjustment (1-365 days)
- **Session**: Current trading session or custom session times
### Performance Optimization Features:
- **Sampling Algorithm**: Reduces calculation load on large datasets while maintaining accuracy
- **Memory Management**: Clears previous drawings to prevent performance degradation
- **Safety Constraints**: Prevents excessive memory usage with configurable limits
## HOW TO USE THIS SCRIPT
### Initial Setup:
1. **Profile Configuration**: Select profile type based on trading style:
- N Bars Back: Precise control over data range
- Days Back: Intuitive calendar-based analysis
- Session: Real-time session development
2. **Row Density**: Set number of rows (30 default) - more rows = higher resolution, slower performance
3. **Delta Method**: Choose calculation method based on market type:
- Price Action: Best for trending markets
- Bid/Ask Estimate: Good for ranging markets
- Cumulative: Smoothed approach for volatile markets
4. **Visual Settings**: Configure colors, position (left/right), and display options
### Reading the Profile:
**Volume Bars:**
- **Length**: Represents relative volume at that price level
- **Color**: Green = net buying pressure, Red = net selling pressure
- **Intensity**: Darker colors indicate volume imbalances above threshold
**Key Levels:**
- **POC (Blue Line)**: Highest volume price - major support/resistance
- **VAH (Purple Dashed)**: Value Area High - upper boundary of fair value
- **VAL (Orange Dashed)**: Value Area Low - lower boundary of fair value
- **Value Area Fill**: Shaded region showing main trading range
**Developing POC Trail:**
- **Blue Dotted Lines**: Show real-time POC evolution throughout the session
- **Migration Patterns**: Upward trail indicates bullish accumulation, downward trail suggests bearish distribution
- **Early Signals**: POC movement often precedes price movement, providing advance warning of institutional activity
- **Institutional Footprints**: Reveals where smart money concentrated volume before final POC establishment
### Trading Applications:
**Support/Resistance Analysis:**
- POC acts as magnetic price level - expect reactions
- VAH/VAL provide intermediate support/resistance levels
- Profile edges show areas of low volume acceptance
**Developing POC Analysis:**
- **Upward Migration**: POC moving higher = institutional accumulation, bullish bias
- **Downward Migration**: POC moving lower = institutional distribution, bearish bias
- **Stable POC**: Tight clustering = balanced market, range-bound conditions
- **Early Trend Detection**: POC direction change often precedes price breakouts
**Entry Strategies:**
- Buy at VAL with POC as target (in uptrends)
- Sell at VAH with POC as target (in downtrends)
- Breakout plays above/below profile extremes
**Volume Imbalance Trading:**
- Strong buying imbalance (>60% threshold) suggests continued upward pressure
- Strong selling imbalance suggests continued downward pressure
- Imbalances near key levels provide high-probability setups
**Multi-Timeframe Context:**
- Use higher timeframe profiles for major levels
- Lower timeframe profiles for precise entries
- Session profiles for intraday trading structure
## SCRIPT SETTINGS EXPLANATION
### Volume Profile Settings:
- **Profile Type**: Determines data range for calculation
- N Bars Back: Exact number of bars (20-500 range)
- Days Back: Calendar days with timeframe adaptation (1-365 days)
- Session: Trading session-based (intraday focus)
- **Number of Rows**: Profile resolution (10-50 range)
- **Profile Width**: Visual width as chart percentage (10-50%)
- **Value Area %**: Volume percentage for VA calculation (50-90%, 70% standard)
- **Auto-Adjust**: Automatically optimizes for different timeframes
### Delta Volume Settings:
- **Show Delta Volume**: Enable/disable delta calculations
- **Delta Calculation Method**: Choose methodology based on market conditions
- **Highlight Imbalances**: Visual emphasis for significant volume imbalances
- **Imbalance Threshold**: Percentage for imbalance detection (50-90%)
### Session Settings:
- **Session Type**: Daily, Weekly, Monthly, or Custom periods
- **Custom Session Time**: Define specific trading hours
- **Previous Sessions**: Number of historical sessions to display
### Days Back Settings:
- **Lookback Days**: Number of calendar days to analyze (1-365)
- **Automatic Calculation**: Script automatically converts days to bars based on timeframe:
- Intraday: Accounts for 6.5 trading hours per day
- Daily: 1 bar per day
- Weekly/Monthly: Proportional adjustment
### N Bars Back Settings:
- **Lookback Bars**: Exact number of bars to analyze (20-500)
- **Precise Control**: Best for systematic analysis and backtesting
### Visual Customization:
- **Colors**: Bullish (green), Bearish (red), and level colors
- **Profile Position**: Left or Right side of chart
- **Profile Offset**: Distance from current price action
- **Labels**: Show/hide level labels and values
- **Smooth Profile Bars**: Enhanced visual appearance
### Alert Configuration:
- **POC Touch**: Alerts when price interacts with Point of Control
- **VA Entry/Exit**: Alerts for Value Area boundary interactions
- **Major Imbalance**: Alerts for significant volume imbalances
## VISUAL FEATURES
### Profile Display:
- **Horizontal Bars**: Volume distribution across price levels
- **Color Coding**: Delta-based coloring for directional bias
- **Smooth Rendering**: Optional smoothing for cleaner appearance
- **Transparency**: Configurable opacity for chart readability
### Level Lines:
- **POC**: Solid blue line with optional label
- **VAH/VAL**: Dashed colored lines with value displays
- **Extension**: Lines extend across relevant time periods
- **Value Area Fill**: Optional shaded region between VAH/VAL
### Information Table:
- **Current Values**: Real-time POC, VAH, VAL prices
- **VA Range**: Value Area width calculation
- **Positioning**: Multiple table positions available
- **Text Sizing**: Adjustable for different screen sizes
## IMPORTANT USAGE NOTES
**Realistic Expectations:**
- Volume profile analysis provides structural context, not trading signals
- Delta calculations are estimations based on price action, not actual order flow
- Past volume distribution does not guarantee future price behavior
- Combine with other analysis methods for comprehensive market view
**Best Practices:**
- Use appropriate profile types for your trading style:
- Day Trading: Session or Days Back (1-5 days)
- Swing Trading: Days Back (10-30 days) or N Bars Back
- Position Trading: Days Back (60-180 days)
- Consider market context (trending vs ranging conditions)
- Verify key levels with additional technical analysis
- Monitor profile development for changing market structure
**Performance Considerations:**
- Higher row counts increase calculation complexity
- Large lookback periods may affect chart performance
- Auto-adjust feature optimizes for most use cases
- Consider using session profiles for intraday efficiency
**Limitations:**
- Delta calculations are estimations, not actual transaction data
- Profile accuracy depends on available price/volume history
- Effectiveness varies across different instruments and market conditions
- Requires understanding of volume profile concepts for optimal use
**Data Requirements:**
- Requires volume data for accurate calculations
- Works best on liquid instruments with consistent volume
- May be less effective on very low volume or exotic instruments
This script serves as a comprehensive volume analysis tool for traders who need detailed market structure information with integrated directional bias analysis and real-time POC development tracking for informed trading decisions.

TradeCreator Pro - Moving Averages, RSI, Volume, Trends, Levels█ Overview
TradeCreator Pro is designed to help you build successful trades by streamlining the processes of trade planning, evaluation, and execution. With a focus on data accuracy, speed, precision, and ease of use, this all-in-one tool assists in identifying optimal entry and exit points, calculating risk/reward ratios, and executing trades efficiently. Whether you’re a beginner or an experienced trader, TradeCreator Pro empowers you to make informed, data-driven decisions with real-time signals and fully customizable settings.
█ Key Benefits & Use Cases
TradeCreator Pro is designed to help you effortlessly discover profitable trades by evaluating and testing multiple setups across different assets and timeframes. Key use cases include:
Quick Strategy Testing: Rapidly test multiple setups and strategies, gaining immediate insights into their potential outcomes.
Risk/Reward Evaluation: Quickly identify which trade ideas are worth pursuing based on their profitability and associated risk.
Multi-Timeframe Testing: Seamlessly test the same trading setup across various timeframes and tickers.
Backtesting: Analyze the historical performance of specific setups to gauge their effectiveness.
Key Level Identification: Instantly spot critical support and resistance levels, improving your decision-making process.
Custom Alerts: Set personalized notifications for key levels, ensuring timely action on potential trade opportunities.
█ Core Features
Dashboard: A real-time view of critical metrics such as trend strength, support/resistance levels, volume profiles, RSI divergence, and trade scoring. Designed to provide a comprehensive snapshot of your trading environment and potential trading outcome.
Trend Analysis: Detect prevailing trends by analyzing multiple moving averages, support/resistance zones, volume profile and linear regressions for RSI and closing prices.
Support & Resistance Identification: Automatically identify support and resistance levels.
Volume Profile: Visualize volume profile and its point of control across support/resistance ranges, helping you spot key consolidation areas.
RSI & Price Divergence Detection: Identify potential divergences between RSI and price through linear regressions, providing valuable trade signals.
Risk Management Tools: Set equity loss levels based on specified leverage, allowing you to manage risk effectively for both long and short trades.
Entry & Exit Recommendations: Identify multiple options for optimal entry and exit levels based on current market conditions.
Trade Scoring: Score each trade setup on a 0-100 scale, factoring in potential ROI, ROE, P&L, and Risk-Reward Ratios to ensure high-quality trade execution.
Dynamic Execution & Monitoring: Benefit from multi-stage exit strategies, dynamic trailing stop losses, and the ability to backtest setups with historical data.
Alerts & Automation: Customize alerts for key market movements and opt for manual or automated trading through TradingView’s supported partners.
█ How to Use
Installation: Add TradeCreator Pro to your TradingView chart.
Trend Adjustment: The system automatically detects the current market trend, but you can fine-tune all trend detection parameters as needed.
Trading Parameter Configuration: Customize entry, exit, profitability, and risk-reward settings to match your trading style.
Entry and Exit Level Refinement: Use the automated suggestions, or choose from conceptual or arbitrary levels for greater control.
Stop Loss and Profit Target Fine-Tuning: Apply the system’s recommendations or adjust them by selecting from multiple available options.
Backtest Setup: Run the backtester to analyze past performance and assess how the strategy would have performed historically.
Set Alerts: Stay informed by setting alerts to notify you when a trade setup is triggered.
█ Notes
The first time you apply the indicator to a chart, it may take a few moments to compile. If it takes too long, switch timeframes temporarily to restart the process.
█ Risk Disclaimer
Trading in financial markets involves significant risk and is not suitable for all investors. The use of TradeCreator Pro, as well as any other tools provided by AlgoTrader Pro, is purely for informational and educational purposes. These tools are not intended to provide financial advice, and past performance is not indicative of future results. It is essential to do your own research, practice proper risk management, and consult with a licensed financial advisor before making any trading decisions. AlgoTrader Pro is not responsible for any financial losses you may incur through the use of these tools.
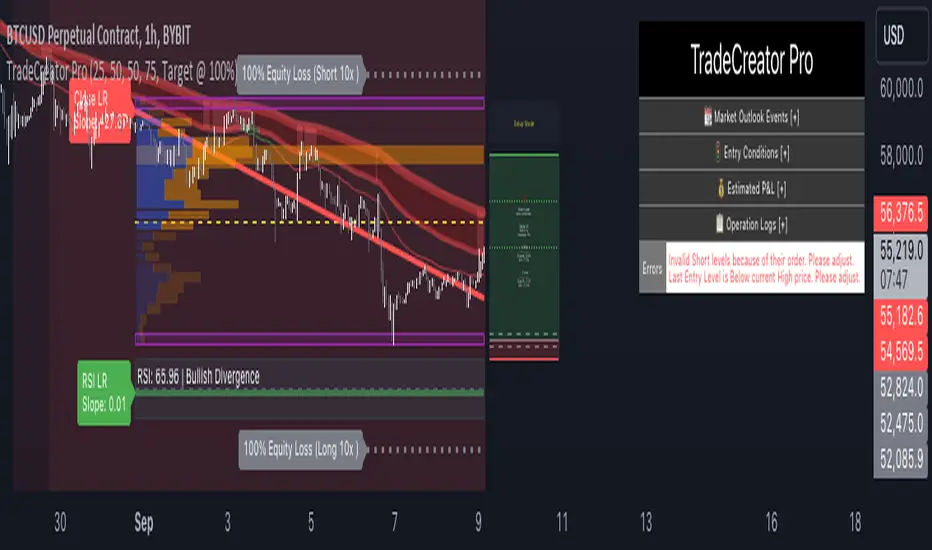
Market Profile with Past SessionsThis script plots market profiles that show the amount of time price has remained at a particular level during past sessions, often referred to as "time price opportunity".
TV user @LonesomeTheBlue created the original Market Profile indicator on which this script is based. This version makes minor changes to the automatic timeframes, and to show historic market profiles and points of control.
The market profile drawing begins at the START of the relevant session being profiled and extends to the right. There is a checkbox in the options that will plot the market profile at the END of the relevant session, if desired.
If you want to view the market profiles for shorter or longer sessions, use the drop down menu to take the Higher Time Frame setting off "Auto", and instead select a specific time interval that is HIGHER than the timeframe your chart is showing.
The market profile and points of control can be used to identify areas likely to serve as potential support or resistance, as well areas where price is likely to retest when it is ranging.

Climax Volume (Zeiierman)█ Overview
Climax Volume (Zeiierman) isolates extreme participation events to pinpoint when price action reaches exhaustion. These moments of volume climax often precede reversals, pauses, or key balance shifts, offering traders an early read on changing market dynamics. Instead of treating volume as a passive tally, it locates climax bars, abnormally large activity bursts, and anchors a Point of Control (PoC) that tracks where post-climax transactions concentrate. The result is a clear read on when participation is peaking, where value re-centers afterward, and how far price can reasonably deviate before reverting.
This tool is designed for multi-context use, such as intraday execution, swing confirmation, or structural bias analysis, offering a precise view of where volume matters, not just how much.
⚪ Why This One Is Unique
Unlike conventional volume-spike indicators, Climax Volume (Zeiierman) integrates adaptive extremum detection, a dynamic PoC core, and multi-layer deviation envelopes that evolve in real time with market context.
Internally, it fuses bid–ask volume delta modeling with re-normalized dispersion mapping to measure the directional imbalance driving each climax event. The system continuously evaluates delta asymmetry between buying and selling pressure to refine the detection of true participation extremes. This allows the engine to differentiate between constructive volume expansion (trend continuation) and exhaustive volume spikes (potential reversals).
█ Main Features
⚪ Climax Volume
The Climax Volume Engine isolates statistically significant bursts in participation that indicate potential turning points or exhaustion phases. It identifies climax bars—instances where volume reaches regime-level extremes relative to recent activity—and classifies them as bullish (green) or bearish (red) based on directional dominance. These events highlight where aggressive activity peaks and often mark the start of structural imbalance, providing early cues for reversal, absorption, or renewed continuation.
⚪ Point of Control (PoC)
Each climax event dynamically re-anchors a Point of Control (PoC)—the evolving price center of post-climax volume distribution. The PoC tracks where transaction density stabilizes after an extreme burst, forming the reference core of a control zone. From this anchor, the system projects upper and lower tolerance bands to define acceptable deviation ranges, contextualizing how far the price can travel before reverting or rebalancing.
█ How to Use
⚪ Trend Following
Use the Volume Point of Control (PoC) as a dynamic guide to assess directional bias. The PoC effectively acts as a moving equilibrium line, continuously updating to reflect where trading volume and market influence are concentrated.
When price holds above the PoC, it signals sustained bullish sentiment and active accumulation.
When the price remains below, it confirms bearish control and ongoing distribution.
⚪ Trend Continuation Retests
The slope of the PoC reflects the strength and persistence of market momentum. The steeper the PoC slope, the stronger the active momentum. A flat or neutral PoC typically signals consolidation or low conviction — conditions better avoided for trend trades.
In a bullish scenario , watch for the price to retest the PoC or the lower tolerance band after a pullback. A successful rejection of that zone often signals that buyers are defending control, providing a high-probability continuation entry.
In a bearish scenario , when the PoC slopes downward, wait for the price to retest it from below. If the market fails to reclaim that level, it indicates that sellers remain dominant, and downside momentum is likely to continue.
⚪ Reversals
Climax Points — the color-coded circles that appear during moments of extreme volume. These signals indicate that the market may soon pause, reverse, or rotate back toward the PoC equilibrium.
🟢 Bullish Climax Points emerge when heavy buying reaches unsustainable levels, often signaling a buyer exhaustion event or a possible local top formation.
🔴 Bearish Climax Points form during high-intensity selling bursts, warning of seller exhaustion and potential bottoming conditions.
⚪ Confirm Breakouts
High-volume breakouts confirmed by Climax Volume signals often mark the initiation of strong directional moves. When climax confirmation aligns with a structural break, it validates that the breakout is backed by genuine participation — not just thin volatility spikes — increasing the probability of follow-through and trend expansion.
Identify a key support or resistance zone manually or with your preferred structural tool.
Wait for a climax signal to coincide with a break beyond that level.
For bullish breakouts , a green climax point appearing as price pushes above resistance confirms that buyers are stepping in with conviction.
For bearish breakouts , a red climax point forming as price drops through support indicates that real selling pressure is driving the move.
█ How It Works
⚪ Climax Detection
Identifies participation surges within a dynamic volume–price field to isolate genuine activity extremes rather than simple bar-size anomalies.
Calculation: Utilizes adaptive extremum detection on a re-normalized volume–delta composite with regime-sensitive thresholds and variance filters to extract statistically valid climax events.
⚪ Point of Control (PoC)
Defines the evolving price centroid where post-climax transactions cluster, continuously adapting to shifting participation density.
Calculation: Employs a volume-weighted delta balance framework with incremental accumulation and curvature-preserving smoothing, ensuring stability while maintaining local reactivity to order-flow asymmetry.
⚪ Tolerance Bands
Outlines a probabilistic corridor around the PoC that distinguishes expected fluctuation from meaningful deviation.
Calculation: Implements variance-aware dispersion modeling with contextual weighting derived from real-time delta gradients, projecting symmetric envelopes scaled by adaptive multipliers.
-----------------
Disclaimer
The content provided in my scripts, indicators, ideas, algorithms, and systems is for educational and informational purposes only. It does not constitute financial advice, investment recommendations, or a solicitation to buy or sell any financial instruments. I will not accept liability for any loss or damage, including without limitation any loss of profit, which may arise directly or indirectly from the use of or reliance on such information.
All investments involve risk, and the past performance of a security, industry, sector, market, financial product, trading strategy, backtest, or individual's trading does not guarantee future results or returns. Investors are fully responsible for any investment decisions they make. Such decisions should be based solely on an evaluation of their financial circumstances, investment objectives, risk tolerance, and liquidity needs.
Bezahltes Script
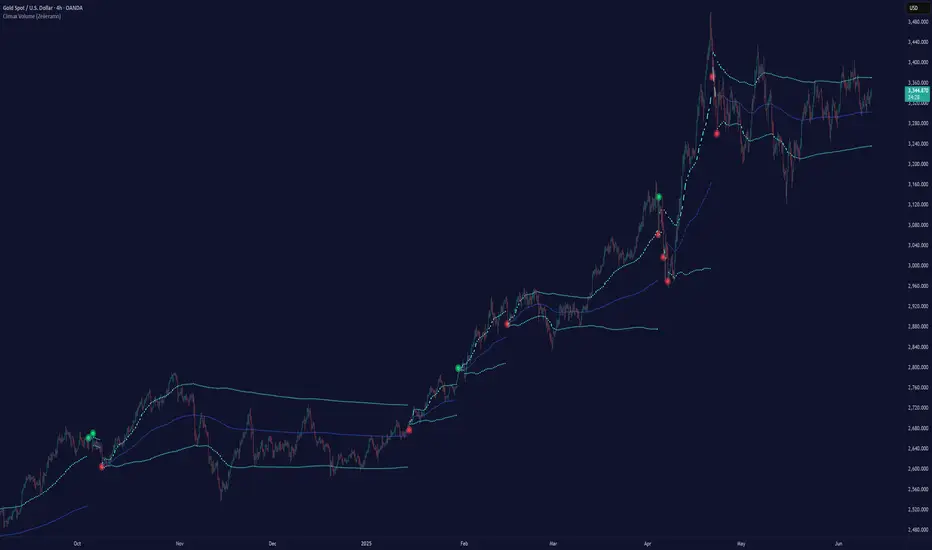
Navigator Triple VolumeNavigator Triple Volume (VWAP + Fixed VP + Flexible VP)
**Navigator Triple Volume** combines three of the most practical volume-based tools into one clean overlay:
1. **VWAP (anchored) with optional deviation bands**
2. **Fixed Volume Profile** (auto-building by anchor timeframe, with optional developing/current profile)
3. **Flexible Volume Profile** (manual start/end window for custom range analysis)
The goal is simple: give you **institutional-grade context**—where price is “fair,” where volume is accepted, and where the real inventory is sitting—without stacking multiple indicators.
1) Anchored VWAP + Bands
This script plots an **anchored VWAP** and optional **±1 and ±2 standard deviation bands** to help you gauge:
* “Fair value” (VWAP)
* Stretch/extension zones (deviation bands)
* Mean reversion vs. trend strength around VWAP
Anchor period options include **Daily, Week, Month, Quarter, Year**, and event-based anchors like **Earnings, Dividends, and Splits** (where supported).
2) Fixed Volume Profile
The Fixed VP automatically builds a **completed profile each time the anchor timeframe rolls over** (ex: Daily). It can also display the **current/developing profile** for the active anchor period.
Includes:
* **PoC (Point of Control)**
* **Value Area (VAH/VAL)** based on a configurable % (default 68%)
* Adjustable **rows (resolution)**, **profile width**, and **bar thickness**
3) Flexible Volume Profile
Flexible VP lets you define a **custom range** using a manual **Start Calculation** and **End Calculation** time selection. This is ideal for:
* Single swing legs
* News/event reactions
* Range breaks
* “From low to high” campaign profiling
Includes:
* PoC + Value Area levels
* Adjustable profile resolution and styling
How traders use it
* Use **VWAP** as the “fair value” magnet and trend filter
* Use **Fixed VP** to identify session/period acceptance and key reference levels
* Use **Flexible VP** to profile *your chosen range* and locate the true battleground: PoC, VAH, and VAL
When all three agree, it’s a high-confidence area for decision-making. When they disagree, it often signals transition or rotation.
Notes
* This indicator draws profiles using TradingView line objects and includes controls to manage performance and display preferences.
* Built for chart clarity: one script, three volume lenses.
